Executive summary
An AODD energy comparison should answer a process question: how much utility input is required to deliver an agreed quantity of liquid under defined conditions? Comparing maximum flow ratings or compressor discharge pressures alone does not answer it.
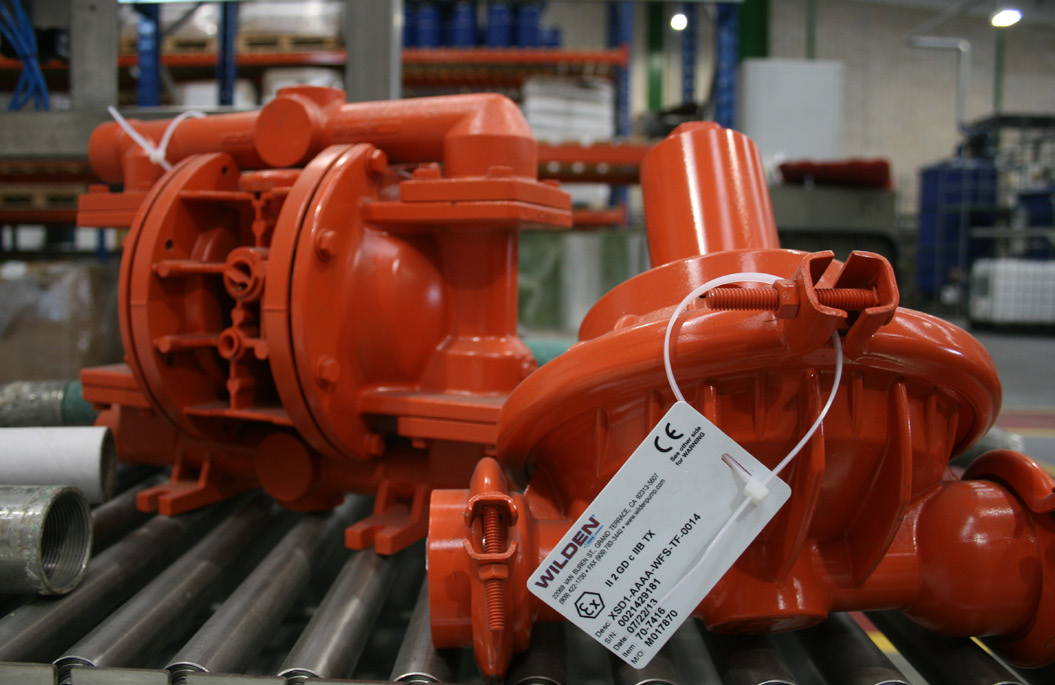
A diaphragm pump air consumption calculation should begin with measured utility input and useful liquid output. Before deciding how to reduce diaphragm pump air consumption, establish a baseline that can be repeated.
This paper provides a plant-level screening method using measured air volume, measured liquid output and an explicitly stated air-cost basis. It is not a certified performance test or a claim about a particular pump model. Its worked example uses assumed numbers solely to demonstrate the calculation.
1. Define the comparison boundary
Choose a boundary before collecting data. For a pump-only comparison, measure air supplied to that pump and liquid delivered through its outlet system. If the question concerns a production line, include the relevant branch leakage, idle consumption and operating sequence within a clearly described line boundary.
Keep the boundaries consistent between the baseline and proposed arrangement. It is misleading to charge all compressor-room losses to one option but compare it with only the drive input of another. It is equally misleading to attribute every reduction in air demand to an immediate reduction in compressor electricity.
Air-distribution design can affect consumption. Wilden describes reducing unnecessary air admission near the end of the pumping stroke as part of the Pro-Flo SHIFT operating concept. Treat a design claim as a reason to test a configuration, rather than as a transferable savings guarantee. [R6]
2. Record a comparable operating condition
Identify the pump configuration, diaphragm and check-valve arrangement. Record fluid temperature, density and viscosity where available; inlet conditions; discharge pressure; and the normal operating sequence. The same nominal pump size can operate at different effective duties after a hose, valve or filter is changed.
Use an air meter suitable for the expected range and pulsating service, and document the installation requirements. State the reference pressure and temperature used for normalized air volume. Do not mix actual compressed volume, standard cubic feet and normal cubic metres without a documented conversion basis.
Measure liquid volume independently where possible, using an appropriate flow instrument or a calibrated collection method. Where mass is used, convert it using density at the relevant condition. A counter multiplied by a catalogue displacement can be a diagnostic estimate, but it should not silently replace measured delivery in a savings claim.
3. Diaphragm pump air consumption calculation
For a matched test interval:
Specific air consumption = normalized air volume / delivered liquid volume.
Express the result as Nm³ of air per m³ of liquid only when the chosen normal reference conditions are declared. A lower value means less measured air was used for the same delivered liquid quantity within that test boundary. It does not, by itself, describe product quality, transfer time or equipment life.
For an annual screening estimate:
Annual air cost = annual liquid volume × specific air consumption × allocated air cost.
The allocated air cost should be supplied by the plant's utility team. It may include more than electrical energy. Label the basis so that different departments do not compare incompatible figures.
4. Worked example – assumed values, not field results
Suppose two acceptable operating arrangements each deliver 5 m³ of the same liquid at the required duty. The baseline consumes 150 Nm³ of air; the alternative consumes 120 Nm³. Assume annual liquid delivery of 6,000 m³ and an allocated air cost of USD 0.025 per Nm³.
| Quantity | Baseline | Alternative |
|---|---|---|
| Liquid delivered in test | 5 m³ | 5 m³ |
| Normalized air used | 150 Nm³ | 120 Nm³ |
| Specific air consumption | 30 Nm³/m³ | 24 Nm³/m³ |
| Annual air requirement at assumed output | 180,000 Nm³ | 144,000 Nm³ |
| Annual allocated air cost | USD 4,500 | USD 3,600 |
The assumed difference is 36,000 Nm³ of air and USD 900 per year on the selected allocation basis. Specific air consumption falls by 20%. These results follow from the assumptions; they are not a WILLEE test, a manufacturer guarantee or a forecast for an unidentified installation.
If the installed incremental cost were USD 3,000, a simple utility-only payback would be approximately 3.3 years. That excludes maintenance differences, installation disruption, financing and the time value of money. A purchasing decision should identify those omissions rather than hiding them inside an apparently precise return figure.
5. Separate air savings from electricity savings
The compressor's control strategy matters. Reduced pump demand may reduce loaded operating time, avoid starting another compressor or simply increase unloaded running. The electrical response can differ in each case. Ask the utility team to estimate marginal electricity savings from the measured change in demand, preferably with compressor power records.
A direct electric alternative adds a further comparison. Graco's QUANTM information describes electric drive and energy-saving potential, but a site calculation still needs matched fluid duty and measured or justified electrical input. The correct question is not whether a brochure percentage is impressive; it is whether the proposed pump produces the required output at a lower whole-system cost. [R1]
6. Test the result before approving it
Repeat runs after steady operation is established, and include representative start, stop and emptying behavior if it matters to the production cycle. Keep raw measurements, instrument identification and the conditions for each run. A single favorable reading can conceal a change in source level or fluid temperature.
The comparison should report throughput and transfer time alongside utility intensity. Reducing pump speed may reduce instantaneous air use while extending the shift or missing the production target. Check that every candidate meets the same acceptance conditions.
For a first uncertainty check, compare the size of the claimed improvement with meter accuracy and run-to-run variation. Do not report decimal-level savings when the input readings or air-cost allocation are only approximate. State whether the economic result is a screening estimate or a measured operating comparison.
7. Practical decision record
Document the original problem, tested configurations, measurement boundary, accepted process duty and financial assumptions on one record. Retain photographs of the installed air connection and liquid pipework; these make later comparisons reproducible. Wilden's installation guidance emphasizes avoiding unnecessary piping restrictions, which can otherwise confound a pump comparison. [R7]
WILLEE can help structure an enquiry using the pump code, flow requirement, discharge condition and available utility measurements. A credible energy proposal begins with a reproducible duty, not an unsupported promise of a fixed percentage reduction.
Technical references
[R6] Wilden / PSG. Optimizing Air Usage in AODD Pumps.
[R7] Wilden / PSG. PS8 Plastic Engineering, Operation and Maintenance Manual.
[R1] Graco. QUANTM Electric Double Diaphragm Pump.
Application photographs are manufacturer reference images, not WILLEE customer-project claims. Model-specific instructions take precedence over this general engineering discussion.
Download the technical white paper (PDF)
Compare cost per useful transfer using matched conditions and a documented air-volume basis.
Discuss this with KevinUse the instructions and specifications for the exact equipment configuration. This article introduces the selection discussion.